Science Nuggets (Activities)
All activities found in this folder may be copied and modified. Many of the lessons have resources attached.
Consider creating a folder first with the activities' name, then copy the activity and the associated resources placing them in the new folder.
-
Are You a Square Student?
 In this math lesson, students will measure their height and then measure the distance between their longest finger to other longest finger (need to have level, out-stretched arms) to determine if they are a square student, a tall rectangular student or a wide rectangular student.
Students will be able to compare the results between classes, grade levels, and even different ALCA communities. In doing so, students can be introducted maximum and minimum values, averages, and possible relationships between different groups of students. -
Are You a Square Student? Student's Guide Copy
In this math lesson, students will measure their height and then measure the distance between their longest finger to other longest finger (need to have level, out-stretched arms) to determine if they are a square student, a tall rectangular student or a wide rectangular student.
Students will be able to compare the results between classes, grade levels, and even different ALCA communities. In doing so, students can be introducted maximum and minimum values, averages, and possible relationships between different groups of students. -
Bacteria: Fermentation of Carbohydrates Copy
Some bacteria, when grown in a sugar broth, will ferment the sugar as part of their normal metabolism. Possible types of carbohydrates that bacteria may use as an energy source are glucose, lactose, sucrose and cellulose. Many bacteria will produce an organic acid (such as lactic acid) and hydrogen and carbon dioxide gases when the carbohydrate is fermented. A fermentation tube can be used to detect acid and gas production. The test is performed by inverting a small tube (such as a Durham tube) inside a test tube which has been filled with the sugar solution, peptone (an acid indicator such as phenol red or bromthymol blue), and a 1% solution of the carbohydrate being tested. When the carbohydrate tube is sterilized, the air will be forced out of the Durham tube and the broth will be forced in during cooling, causing the tube to be completely filled. If the bacteria that are introduced into the tube are fermentors, the small Durham tube will collect some of the gas that is released during fermentation. If the product is an acid, then the indicator will change colors (both phenol and bromthymol blue will turn yellow in the presence of an acid).
-
Can It: How Much Energy Can You Save by Recycling? Copy
Toss the aluminum can or recycle it. These are your choices. Toss it and the can ends up in a landfill, but if you recycle the can, the aluminum will be used to make new products and will save energy. Did you know that recycling just one aluminum can saves enough energy to keep a TV running for three hours? What are the other benefits of recycling aluminum cans? Complete this activity to see how much energy your class can save by recycling cans. Recycle the cans for your school and reap the financial benefits of recycling, too. How does the price per pound of aluminum cans compare in your community with the price in other communities?
-
Can Litter Disappear? Student's Guide Copy
Does your school have a litter problem? Many people drop trash without even considering the consequences. Does it just disappear? Is it really biodegradable? Students will test the biodegradability of litter they find on their playground and record the results. Students will decide how they can make a positive impact on their community in regards to litter.
-
Can Litter Disappear? Teacher's Guide Copy
Does your school have a litter problem? Many people drop trash without even considering the consequences. Does it just disappear? Is it really biodegradable? Students will test the biodegradability of litter they find on their playground and record the results. Students will decide how they can make a positive impact on their community in regards to litter.
-
Can You Calculate Your Lung Capacity? Copy
Have you ever wondered how much air your lungs hold? This is an easy activity for measuring and calculating the volume of air that you exhale. Normally this is done by using a spirometer. In this activity, you will calculate the volume by determining the radius of a balloon that you have inflated.
-
Chromatography: Leaf Pigments Copy
As you may have noticed, plants display a variety of colors depending on what season of the year it is. These color displays are created by a variety of pigments. A pigment is a substance the will absorb light. For example, if you have a leaf that is red in color, it will reflect light wavelengths in the red portion of the visible light spectrum and abosorb the other wavelengths.
Some leaf colors are produced by only one pigment, while a greater diversity of colors are produced by the accumulation of different pigments. Chlorophyll-a will produce a bright green to blue green color . Cholorphyll-b will produce a color which is yellow green to olive green. Yellow to yellow orange or possibly red will be produced by carotenoids. Pale yellow is produced by xanthophylls. All of these pigments are located in the chloroplasts. These pigments are not water soluble. Other colors such as the blues, purples, violet, pinks and dark reds are usually produced by a water soluble pigment called the anthocyanins. These are located in the vacuoles and are not part of the photosynthetic processes.
You will be using the process of chromatography to separate and identify the type of pigments found in leaf samples. The solvent will travel up the paper by capillary action. This is due to the attraction of solvent molecules to the paper and the attraction of solvent molecules to one another. As the solvent moves up the paper, the dissolved pigments will be carried along. These pigments will be carried along at different rates because they are not equally soluble and will have different degrees of attractions due to hydrogen bonding. The less the degree of hydrogen bonding, the farther the pigment will travel. If molecules contain oxygen or nitrogen, they tend to bond more tightly to the paper and not move as far up the solvent line. -
Critical Thinking: A Primer for Lab Analysis Copy
The student will take a statistical survey. Through the analysis of that data, the student will learn the concept of 'empirical evidence'. Additionally, the student will gain a knowledge of 'anecdotal evidence'.
-
Crossing Signs - What Creature Crosses Here? Copy
Traveling in automobiles, we see evidence of creature crossings on the roads. We also see warnings about these crossings. In this activity, students will observe and record the locations of deer crossing signs in their local area. Students will interview a game warden to find the locations of deer killed by traffic. Locations will be plotted on a map. In their study, students will consider the following questions: Were the signs correctly placed? Why do deer cross here? When are they more likely to be crossing? Is there a difference in the number of male and female deer that are hit by traffic? Are there certain times that they are more likely to cross? When? Why? How does this compare with other communities? Are there no deer crossing the roads where you live?
-
Do Trees Sweat More at Night or During the Day? Copy
Students will observe tree transpiration and compare the amount of water released during the day versus during the night. This activity provides a good review of the scientific method. Learners will be given opportunities to hypothesize, collect data, and draw conclusions.
-
Earth and Moon: What a Pair! Copy
Students may know that the moon is one-fourth the diameter of the earth. However, the moon is MUCH LESS than one-fourth the volume of the earth. This lesson demonstrates this concept. Also included in the lesson's enrichment activity is information on applying the concept to the earth-sun relationship.
-
Earthquake Cake Dig Copy
Students will use a chocolate earthquake cake to learn processes of weathering and erosion, topography, fossils, molds and casts, and rigor of a geologic dig.
-
Field Data Sheet Tool Copy
Today you will begin an exciting journey into the arena of biological field-study. In small groups, you will stake-out an area of land to survey. More specifically, you will count and identify the plants and animals within your chosen plot of ground.
-
Have You Seen My Soil? Copy
Can soil be red? Can it be black? Make a peep-hole from a paper plate and go exploring for the color of soil found in your yard. Your class will tally the results on the graph provided. What fun then to compare your soil colors with those found in other areas!
-
High in the Sky! a Bird...a Plane...No! the Sun! Copy
This lesson is really quite simple, with very little equipment needed. It is a variation of the "height of the flagpole" activity. The advanced mathematical concepts of tangent and arctangent are introduced, by using a tangible triangle. Enrichment or expansion of the activity will help students observe that the sun is at different levels above the southern horizon, depending on one's location north or south of someone else.
-
How Can We Enhance Community Wildlife? Copy
Students will determine what wildlife is found on the school playground and compare the results with another local site. The students will learn how to observe, classify, and gather wildlife information on a developmentally appropriate level. The final product will be the creation of a butterfly habitat outside a classroom to encourage wildlife to return to this area.
-
How does a leaf's surface area affects transpiration Copy
Have you ever wondered about the different sizes of leaves on trees and what this means about the tree? In this activity you will observe tree transpiration of leaves from a specific tree and then determine the amount of water that is released as related to surface area of the leaves.
-
How Do We Recycle Waste Water? Copy
What happens to water that goes down your drain? If three-fourths of the Earth's surface is covered with water, do we need to worry about running out of water? This activity explains why we do need to worry about our water supply and how we treat water that goes down the drain.
-
How Fast Is the Snow Falling? Copy
This activity is designed to enable students to collect data on the weather, use their math skills on it, and transfer it into information that a meterologist would report, i. e., mean (average) snow fall rate.
-
How High is the Sun? Only the Shadow Knows! Copy
Measure the angular height of the sun using shadows. This information will be graphed and compared to other locations in the state or world. By measuring the angle of the sun, you will be able to determine how the angle changes due to latitude, longitude and the time of the year.
-
How Many "C"s Are in Your Juice? Copy
Have you ever wondered how much vitamin C is in your garden tomatoes? You have heard that a healthy diet should include foods that are rich in vitamin C. Your job is to determine if there are any differences in vitamin C content compared with your neighbors garden. If there are differences, be prepared to explain why. -
How Many Steps Are There to Your Room? Copy
This activity is designed to enable you to transfer concrete data to a graph of a coordinate plane. You will be able to see the use of a coordinate plane with a real life mapping situation. You will also plot and compare this information with other students.
-
How Much School Lunch Do You Dump? Copy
Get up to your elbows in dumped lunch. In this activity the students will collect and measure the wasted lunch for their grade during one week. They will find the average number of ounces wasted by each student and compare this with classes in other communities. How does your school lunch rate?
-
How to Construct a Cause and Effect Chart Copy
Why? Have you ever been stuck when asked this question and simply answered "because?" With this Aurora Tool, you can learn how never to be stuck again. Use a cause and effect chart to show the relationship between causes and effects. This chart will show how sometimes multiple causes lead to one effect and how, at other tmes, one cause leads to several effects. With this tool, you can learn words that signal the important relationship between the cause and effect.
-
How to Make a Hanging Drop Slide Copy
The "hang-drop" method allows the examination of a microorganism in its natural environment. This method allows the organism to maintain its natural shape and size. It also allows one to determine if the organism is motile (capable of moving itself).
-
Introduction to Biomes Copy
This lesson is the first lesson of five whose end result is a group presentation of a 4' x 5' display of a specific biome. This lesson groups the students and gives them some background on biomes.
-
Invertebrate Populations Copy
The majority of animals on earth are invertebrates of one form or another. They are animals with no backbone and include sponges, corals, seastars, insects, crabs and worms, just to name a few.
Invertebrates are found just about everywhere. In this lesson, students will determine how many different types of invertebrates can be found in the students' community. -
Is it safe to breathe? Copy
In this experiment the students will make their own pollution detector to check pollution levels in different locations. They will then have the opportunity to compare their results to the rest of the class, as well as classes in other parts of the country.
-
Is Left-handedness Gender Related? Copy
How do left-handers feel living in a right-handed world? This activity allows the student to analyze hand dominance among boys and girls.
-
I Wonder Where the Leaves Are Changing? Copy
Create maps of where the leaves are changing colors in the state. Hypothesize why those changes occur by researching the weather of the different regions of the state.
-
Jello and potatoes; cells and osmosis Copy
To construct models of plant and animal cells using Jello and small objects as well as observe osmosis with salt, water and potatoes.
-
Making a Tornado in a Bottle Copy
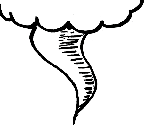
Tornadoes! Tornadoes! They are a common weather occurrence in many areas of the country. This tool will allow students to construct a concrete model of this weather event. It will help students to understand the power and effects of a tornado better. This is an easy and fun educational project for first graders. -
Mapping: Map a Watershed Using Topographic Maps Copy
This tool can be used to map a watershed with a topographic map and to help students understand how to read a topographic map. The information contained in this tool comes from the Texas Watch "Manual for Conducting a Watershed Land Use Survey" available from the Texas Natural Resource Conservation Commission.
-
Microbes of the Soil Copy
By using this proven technique, we want to isolate as many different top-soil and sub-soil microbes, within our community as possible.Without any previous study in the microbiology field, most biology students assume that microbial life would be most abundant in the prescence of air [or above ground]. That assumption would infer that the number and variety of microbes, just a few inches deep, would be reduced. Let's see how that assumption holds up in our neighborhood.
-
Mini Lab - Left to Right or Right to Left? Copy
This Mini-Lab is designed to enforce previously learned knowledge of DNA sequencing. Its use in this lesson is to refresh the students on the importance of interpreting DNA in one direction only.
-
Mini Symposium on Genetic Disorders Copy
Ever wonder about genetic disorders? This activity has each student do research on a specific genetic disorder and make a class presentation, reporting the disorder. The collective presentations, the symposium, broadens the awareness of the entire class.
-
"One Small Step..." Copy
Just how many steps is it from the sun to the Earth? You will "step off" the distance from the Sun to the Earth.
-
Owl Pellets: "What's in Your Mystery Foil?" Copy
Have you ever wondered what owls eat? Since owls eat their prey whole and then regurgitate the indigestible parts as owl pellets approximately 12 hours after eating, you can identify what the owl has eaten. The compact pellets contain bones, fur, etc. Using a mounting sheet and the bones, you can reconstruct the skeletons of the consumed animals. A dichotomous key helps you make a definite identification of the consumed organism's skull. This activity may be used to suggest a local food web.
Source: Mac McCullum -
Plant Cultivars: Where Do Your Roses Grow? Copy
Southern burial traditions usually included the planting of antique roses at gravesites, a practice that spread to other areas. Students will visit cemeteries, document their locations using latitude and longitude readings, and photograph rose bushes found at gravesites. Noting the death dates on the gravestones will approximate the age of the rose bushes and the rose bushes will be identified by classification. The photographs will be used to create a virtual rose bush gallery. This is the introductory activity in series on local history using antique roses as the vehicle for the series.
-
Properties of Chalk and Baking Soda Copy
Observe the physical and chemical changes of chalk and baking soda.
-
Puttin' Those Bugs Together Copy
This is a simple tool for students to record the information on the twelve different insects collected in the "What's Buggin' You?" lesson. After recording the data, students will compare data within the classroom and with others who have used the "What's Buggin' You" lesson.
-
School Scavenger Hunt Copy
Having student locate and map the locations of very specific items in the school brings the art of map making and the skill of map reading into the school.
-
Simple Leaf Pressing Copy
Botanists press leaves in order to perserve them and study their characteristics. By using this tool, you will learn a very simple way to press leaves in order to preserve and identify the leaves <i>you</i> have collected.
-
Testing for Vitamin C Copy
Vitamins are organic compounds that are needed by the body. Many vitamins act as coenzymes during metabolic reactions. If the coenzymes are not present, then the reactions will not occur. Vitamin C is important in protein metabolism. It is needed to maintain blood vessels, gums, bones, etc. It also acts as an antioxidant which defends the body against free radical attacks on tissues. Another name for Vitamin C is ascorbic acid. By using this tool, you will be able to determine the amount of vitamin C in fruits, vegetables, and other products. -
The Leaves Are Changing - I Wonder Why? Copy
You will observe when tree leaves begin to change to their fall colors, record related information, and hypothesize why leaves change colors. This information can be compared to data collected in other cities in order to see if location affects when leaves change. If you wish to map locations of the color changes in leaves, try the I Wonder Where the Leaves Are Changing? Aurora activity.
-
This Dirt Really Rocks! Copy
This activity will allow the student to take soil samples and test the sample for its pH. This activity can be as simple as using blue and red litmus paper to test only pH or it can be made more complex by using pHydrion paper, or even N-P-K test kits.
-
To Dew or Not to Dew, That is the Question Copy
Dew is hiding all around us each and every day! This activity will aid in detecting dew, making it visible, and its significance in the weather that affects our everyday lives. Comparisons with dew points in other areas could provide information for the student to plot dew points on a map and see different air masses, their boundaries and weather associated with each.
-
Transpiration: Do Trees Sweat" Copy
Have you ever wondered if trees can transpire, that is, give off water? This tool will allow you to see and measure tree transpiration. This is done by measuring the amount of water a tree releases to the atmosphere over a period of time. -
Variations in Plant Populations Near Streams Copy
We want to quantitatively study how the vegetation changes the further a plant is from a stream. Logically, you would expect that the greater the distance from water, the fewer plants would be found. However, do other variables come into play? Concluding this activity students will hypothesize the cause(s) for the degree of variations.
-
Was the Ground Hog Right This Year? Copy
February 2... the day the ground hog awakes to help us determine if spring has arrived or if there will be 6 more weeks of winter! Your students will enjoy predicting the end of winter or the beginning of spring-like weather and then collecting information to see if the ground hog was right!
-
Was the Ground Hog Right This Year? Copy
Feburary 2... the day the ground hog awakes to help us determine if spring has arrived or if there will be 6 more weeks of winter! Your students will enjoy predicting the end of winter or the beginning of spring-like weather and then collecting information to see if the ground hog was right!
-
Watershed Land Use Survey Copy
This survey includes procedures for determining how land usage might affect a particular area, such as a stream, lake or habitat. The survey can consist of a "walk through" of an area, or reading maps of an area to determine the approximate impact of the following: oil and gas drilling; housing developments; forest logging; parking lots/roads construction; landfill; ongoing construction; farming; ranching; and so on. This tool was created from the "Texas Watch Manual for Conducting a Watershed Land Use Survey".
-
Water: What is your "DO" (Dissolved Oxygen)? Copy
Dissolved oxygen is very important factor to measure when performing water quality tests.This tool demonstrates how to determine O2 concentration in parts per million.
-
"Weight" a Minute! How Much is a Ton? Copy
Are you talking to your students and other people about the amount of solid waste produced in your community? If you are, then you are probably talking about tons. But how much is a ton in terms that you can understand? In this Aurora Activity you will collect throw-away items, weigh the items, and collect enough to make a pound. Then you will determine how many it takes to make a ton by making a team drawing. Finally, you will use weight comparisons and fun facts to compare the possible amounts of solid waste in various locations, based on community population.
-
What Do Barometers Tell Us? Copy
This activity has students make barometers and investigate the correlation between air pressure and weather conditions. Completing the activity will have students acquire knowledge of could types
-
What Do Our Water Habitats Teach Us? Copy
Students will investigate a pond or stream using sampling techniques. They will observe wildlife and pH levels in the water collected to determine if it is a healthy habitat. The students' love and curiosity for the outdoors will be the motivating force behind this lesson.
-
What is That Smell? Copy
You usually greet your students in the morning with a smile and a cheerful "Good morning!" Today will be different. You will prepare an experiment before the students enter the room and instead of coming in with that sweet smile, they will be holding their noses and saying, "Ew! What's that smell?" They will want to know what has polluted their environment! They will learn the effects of acid rain.
-
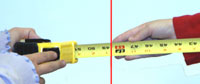
What is Your Measure? Copy
Users will be able to find the real world connection with using measurements and the outside world t. This activity incorporates one of the user's favorite things to do, and that is to go outside.
-
What Is Your Phenotype? Copy
Humans display numerous traits controlled by a variety of genes. Some of these traits are determined by two alleles, one dominant and one recessive. Other traits may be determined by three or more alleles, sex-linked, etc., or by a combination of environmental factors. Dominant and recessive traits are studied in this activity, utilizing the Hardy-Weinberg scheme, whereby evolution can be viewed as changes in the frequency of an allele in a population of organisms. This indicates that no matter how many times alleles are segregated into different gametes by meiosis and united in different combinations by fertilization, the frequency of each allele in the gene pool will remain constant if the following conditions are met: the breeding population is large; mating is random; there are no mutations of alleles; no differential migration occurs; and there is no selection.
-
What's Buggin' You? Copy
What kind of "bugs" do you have in your community? In this activity, students will "collect" 12 different types of insects and then, through contacts with students in different areas, regions, states, and even countries, insect information can be exchanged.
-
What's in Your Square? Copy
Students will map an area in the field, record the information, and then identify rocks and minerals, vegetation, wildlife, and the soil type within the area.
-
What's the Weather Like Today? Copy
Students have a natural curiosity about weather. In this activity, they will use data collecting skills to record the high and low air temperature for 10 days. A student-made rain gauge also will be used to record the daily precipitation. Students will record the soil temperature every hour for 1 day to see if the soil temperature changes. The class will compare and contrast these data and decide how weather affects people in our community. The results will be posted on the web so that other classrooms may contribute their data. You may want the students to generate other data they want to collect, such as light intensity, humidity, etc.
-
"What's Your Angle?" Copy
Have you ever wondered if your shadow is as long as you are tall? During this activity you will measure how long your shadow is and which direction it is pointing. Then compare how this changes depending on the season.
-
What's your type? Copy
This lesson is not yet done but it gives a good direction for students to discover qualitative and to a lesser degree quantitative data using soil.
Copy it and modify ....
-
Where in the Sky is that North Star? Copy
On an activity sheet, students will plot the locations of the North Star, the celestial equator (which is the same as the autumnal and vernal equinox), and the zenith of the Sun at summer and winter solstices. Then students will estimate the positions of these plots for different latitudes. Lastly, students will compare their plots with those from other locations.
-
Who's Taller? Copy
This is a simple activity for making observations over a period of time.
-
Why Do We Have to Study Science? Copy
Students will interview people in their city about common folk sayings, such as "many turtles on the road means rain," or "when the wind is in the west, the fishing is the best." These sayings will be shared in class and students will suggest whether they agree with them. Students will attempt to determine whether the sayings have any factual basis. As they proceed, students will begin to see that the factual method of scientific understanding the world around us is needed. Students will also be encouraged to compare the sayings from their community to the sayings from other communities.