3. How Square are You? - Analyzing Data (Activity) (Copy)
In this activity we discover how data becomes information. We explore and analyze the data submitted to the How Square are You" form to discover what information we can conclude. From this information, we will draw on what knowledge we develop for use in our lives.
Engaging Questions
-
Data Becomes Information
How can measurement data become information?
Learner Goals
-
Analyzing Data
To collect and analyze data sets. -
Interpreting Graphs
To create and interprete graphs.
Required Resources
-
How Square are You? Form
The data entered in the How Square are You? form previously is used to demonstrate how data can be used to create purposeful information.
Steps
-
Select Form
Click on the How Square are You? form link below.
NOTE: The form will appear in this window hiding the remaining instructions in this activity. Consider printing this page before clicking the link so that you will have a copy to continue working. -
Click Comprehend
 Clicking the Comprehend button will display both your data and that of others for you to analyze.
 -
Click 2) Filter Data
 Clicking the Filter Data option will display the different options you can use to filter the data for analysis.
 -
Explore Data using Filters
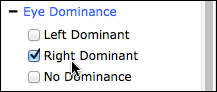 Explore and reflect on the data table as you review each filter option. Consider patterns in the data as dictated by the filters you select.
 -
Explore Data using Column Options
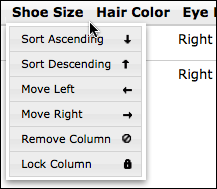 Explore patterns in the data by:
- Sorting data by column.
- Moving columns next to each to reflect on possible relationships between the column data.
-
Click 3) Generate Reports
Clicking the Generate Reports option will display the different charting options. Charts make possible for farther analysis of the data.
Explore the different chart options to view how data may be related.
NOTE: You can select different filters while still viewing are chart. The chart will automatically update.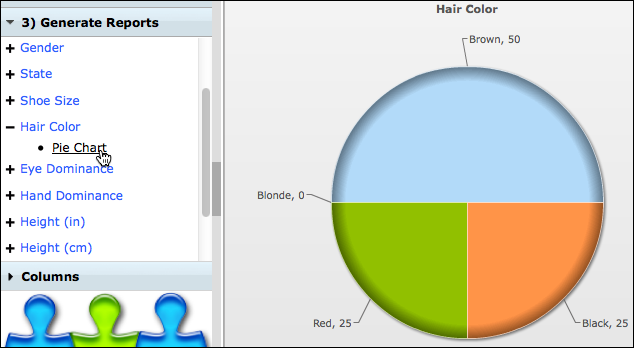
-
Analysis Data for Relationships
Using the strategies from the above steps, hypothesize and test for possible relationships within your organization's (district) data. identify and describe the relationships between two or more data fields. Consider looking at:- Gender
- Height
- Age
- Difference in Height and Arm Span measures
- Grade Level
-
Data Results across Organizations
After determining data relationships within your organization, select another organization of your choosing and determine if, and to what extent, the relationships are consistent. Explain your findings.
In the room, click on the Compare/Contrast Data within & between Sites link and report back your findings to the other teams. -
Data into Information
With your elbow partner, discuss how in this activity the data you analyzed became information. In this example, explain how the data is different from the information you discovered.
Report back to the group your conclusions. Listen to the different perspectives the other partners in the room developed and reflect on how your conclusions might be adapted.