Jot-Charting
Jot Charting is a helpful tool for students that serves as an outlining tool for organizing related information. It useful for visualizing information that involves ideas, people, events and processes.
-
Create a Jot Chart
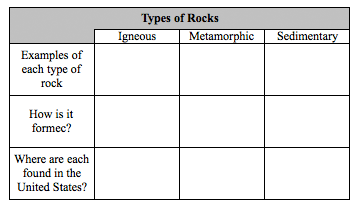
With help from your teacher, create a Jot Chart (matrix) that has a structure as follows:
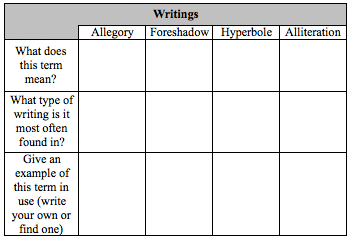
- Main ideas/items for description or analysis are listed across the top of the chart.
- Question/characteristics fo the main ideas/items are listed down the left side of the chart.
-
Types of Rocks Example
-
Writing Example
-
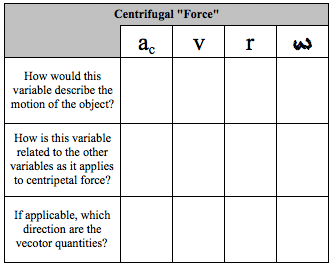
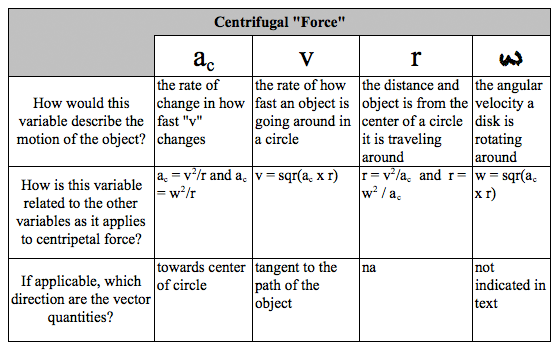
Centrifugal "Force"
This is an example text from a physics textbook. Consider how the Jot Chart was derived from the text.
Suppose you fasten one end of a spring to the center of a rotating platform. An object lies on the platform and is attached to the other end of the spring. As the platform rotates, an observer on the platform sees the object stretch the spring. The observer might think that some force toward the outside of the platform is pulling on the object. This apparent force is called centrifugal “force.” It is not a real force because there is no physical outward push on the object. Still, this “force” seems real, as anyone who has ever been on an amusement-park ride can attest.
As the platform rotates, an observer on the ground sees things differently. This observer sees the object moving in a circle. The object accelerates toward the center because of the force of the spring. As you know, the acceleration is centripetal acceleration and is given by ac = v2/r. It also can be written in terms of angular velocity, as ac = w2/r. Centripetal acceleration is proportional to the distance from the axis of rotation and depends on the square of the angular velocity. Thus, if you double the rotational frequency, the acceleration increases by a factor of 4.
View Answer
-
Reflect
In pairs discuss, how might the Jot-Chart be modified to better serve comprehension of the text read. -
Compile
As a class, compile results into a group Jot Chart while stressing the relationships the data in the chart as it relates to the text. The evidence of the data MUST be observed from the text read. -
Discussion
Discuss with one another in class your results. How is your Jot Chart different from anothers? Why? -
Read
Once the Jot Chart has be constructed and/or shared, read the provided text and complete the Jot Chart.
Standards
-
Common Core State Standards: ELA Standards for Science/Technical > 6-8 > KID > S.1
Cite specific textual evidence to support analysis of science and technical texts.
Content Skills Learning Targets Big Ideas Essential Questions Evidence5 - Cite (specific textual evidence)
4 - Analysis (science and technical texts)
5 - I can cite specific textual evidence.
4 - I can analyze science and technical texts.
A. 1 Frequently recurring evidence points to probable support and answers.
B. 1 Analysis of textual information is essential for drawing conclusions.
B. 2 Evidence is essential to support one's analysis of textual information.
A.1 How do you know if cited evidence supports a particular analysis?
B.1 Why do we need to analyze textual information?
B.2 What strategies can be used to analyze science and technical texts?
-
Common Core State Standards: ELA Standards for Science/Technical > 6-8 > CS > S.4
Determine the meaning of symbols, key terms, and other domain-specific words and phrases as they are used in a specific scientific or technical context relevant to grades 6–8 texts and topics.
Content Skills Learning Targets Big Ideas Essential Questions Scientific MeaningTechnical Meaning4 - Determine (meaning)
4 - I can determine meaning of a symbol.
4 - I can determine meaning of key terms.
4 - I can determine meaning of domain-specific words.
4 - I can determine meaning of domain-specific phrases.
A. Symbols, key terms, and domain-specific words and phrases are based on specific scientific or technical meanings.
A. How is meaning determined within a context?
-
Common Core State Standards: ELA Standards for Science/Technical > 6-8 > IKI > S.7
Integrate quantitative or technical information expressed in words in a text with a version of that information expressed visually (e.g., in a flowchart, diagram, model, graph, or table).Content Skills Learning Targets Big Ideas Essential Questions Text Information4 - Integrate (quantitative information with visual content)
4 - Integrate (technical information with visual content)
4 - I can integrate quantitative, textual information into visual products.
4 - I can integrate technical, textual information into visual products.
A.1 Combining textual information with visual products facilitates understanding.
A.1 How might text placement differ for quantitative and technical information?
-
Common Core State Standards: ELA Standards for Science/Technical > 6-8 > R > S.10
By the end of grade 8, read and comprehend science/technical texts in the grades 6–8 text complexity band independently and proficiently.
Content Skills Learning Targets Big Ideas Essential Questions 1 - Read (Grade 8 texts with proficiency)
2 - Comprehend (Grade 8 texts independently)
1 - I can read science and technical texts independently and proficiently.
2 - I can comprehend science and technical texts independently and proficiently.
A.1 Ability to independently read and comprehend texts is central to interpreting science texts.
A. 2 Knowing purpose helps students tap into prior knowledge to unlock understanding.
A.1 Why can reading strategies help one better understand science texts.
A.2 How can reading strategies help in understand technical texts.