Troughs and 300 mb Pressure Graph
At beginning of school we talked about troughs and ridges that determined the kind of weather we might have locally. In this activity we are going to look at the present conditions and create a graph of 300 mb to elevation across North America to get a better understanding of lows/troughs.
Materials Needed:
- Graph paper
- Weather map
- Logger Pro Graph File
- Metric ruler, and
- Pencil
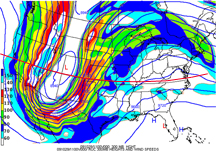
We are about to make a graph that shows the elevation of the 300 mb pressure reading across North America. This will give a profile of a Low pressure area.
Graphing Instructions:
- Use the metric ruler and mark a dot easily seen every 1/2 cm along the line that goes across North America just North of Oklahoma.
- To better keep track of our data, label every tenth dot so that one can see on the Weather map 0, 10, 20, 30, 40 etc series.
- For each dot, estimate the elevation where the atmospheric pressure is 300 mb. Record the elevation data.
- Use the graph paper provided and graph the elevation data.
- To check your work from the above graph, use the attached LoggerPro file. Note that this program will automatically graph results just enter in the elevations.
- Copy the resultant graph from (Logger Pro) on to a Word document. Also copy and paste the weather image to the same document.
- Make at least five observations relating the elevation graph and weather map.
-
What to turn in:
- Turn in the word document attaching it to this assignment, and
- Turn in the hardcopy graph you created into tray making sure to include your name and period.