Graphing 850 mb, 500 mb, and 300 mb Heights
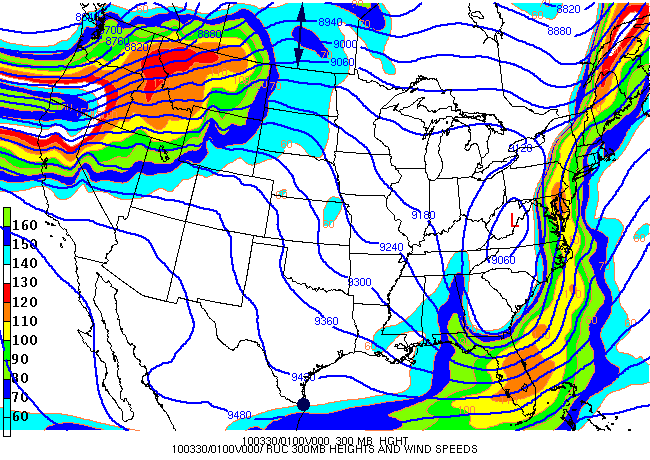
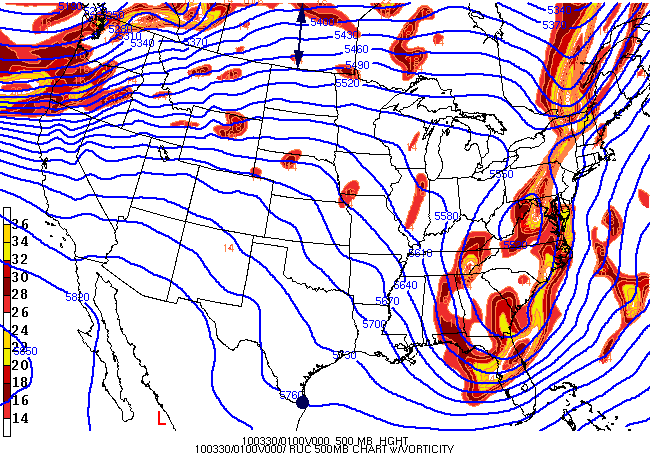
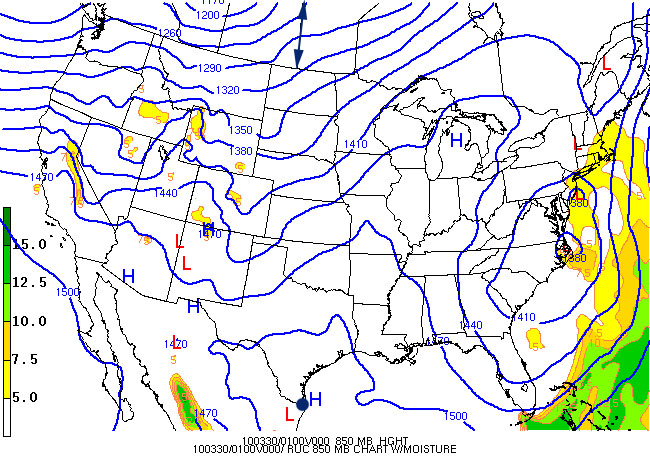
Essential Question:  How does the elevations vary for 850 mb, 500 mb, and 300 mb heights South to North?

Answer the question by using these three pressure-elevation maps to create three line graphs.  

1.  Use the attached number line provided in class (as a transparency) and for each dot estimate the elevation for the 850, 500, and 300 mb pressures.  In order to align dots from map to map, place one arrow on dot located at bottom of Texas and the align the number line up to the boarder identified by the arrow line.  Repeat for each map, entering data into the attach Logger Pro file already made for you.

2.  Place the graph and all three maps onto a Word document and provide an explanation interpretation of results.  

3.   Attach to assignment.

850mb.jpg
300mb.gif 500mb.gif
   

Resources

  • Resource

    Map Scale.jpg

    These number lines are already provided in class as strips on transparency.  This will make it a lot easier to complete assigned task.

  • Resource

    3Pressure Heights Graphs.cmbl

    This LoggerPro file will let you graph 850 mb, 500 mb, and 300 mb heights across 24 dots.
Please enter a Registration Key to continue.