T2. Identify 3 Highest and Lowest SOPI Performance
Identifies areas of strength and weakness, as measured by performance on inidvidual OCCT standards and objectives.
Instructional Notes
No Plan Available
Instructions
No Instructions Available
Steps
-
Identify SOPI Strength and Weakness (Average)
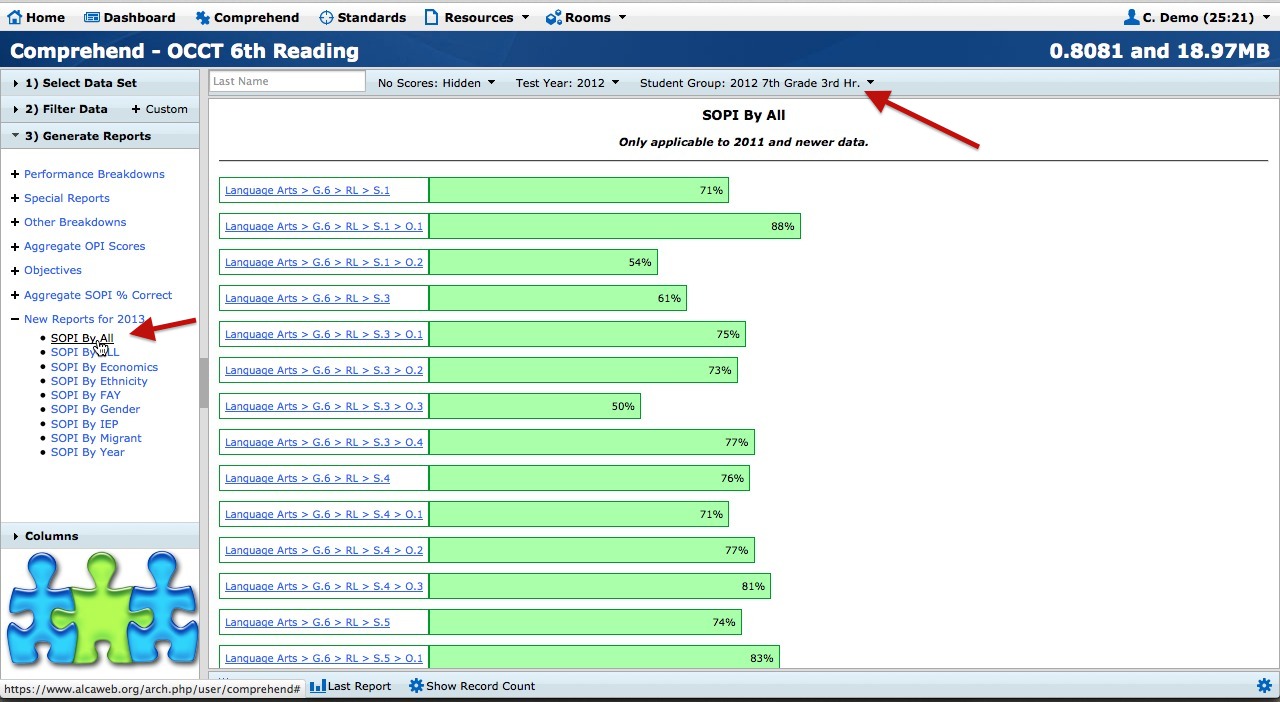
Select OCCT/EOI data set that you teach. Filter by Student Group that you created.- Go to the New Reports for 2013. Select SOPI By All. This report shows the data by percentage and a hyperlink to identify the specific standard.
-
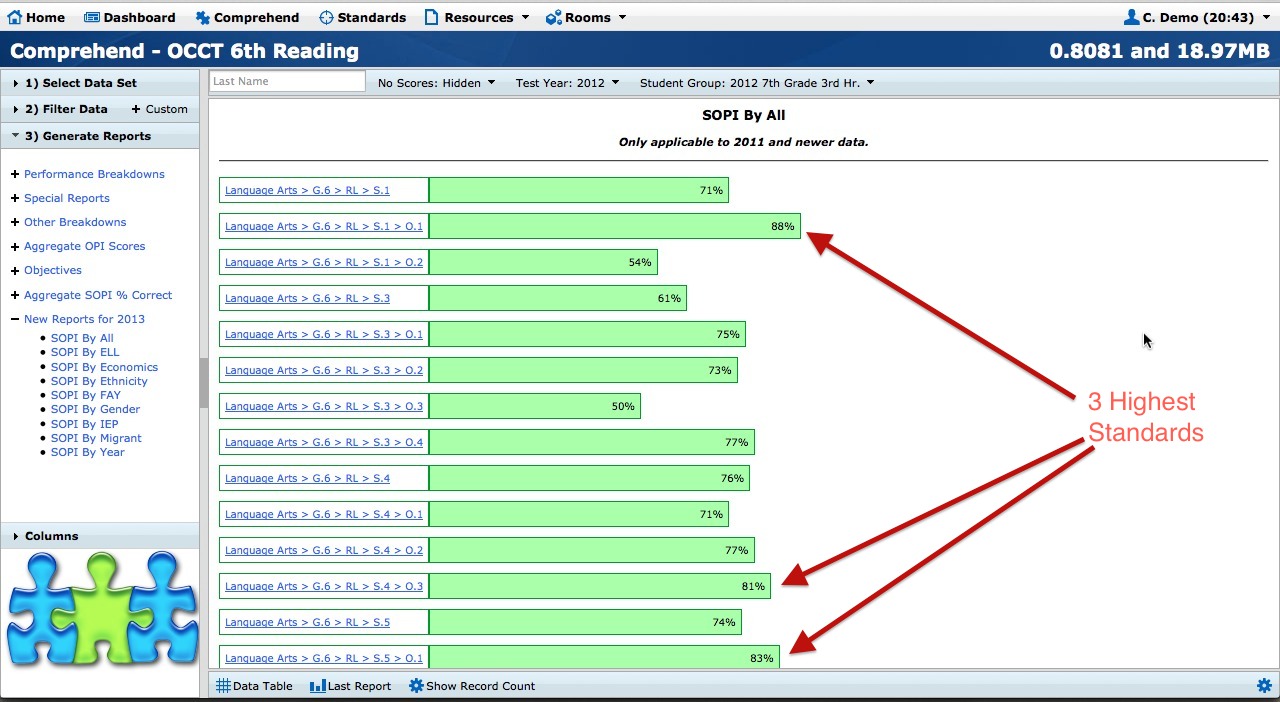
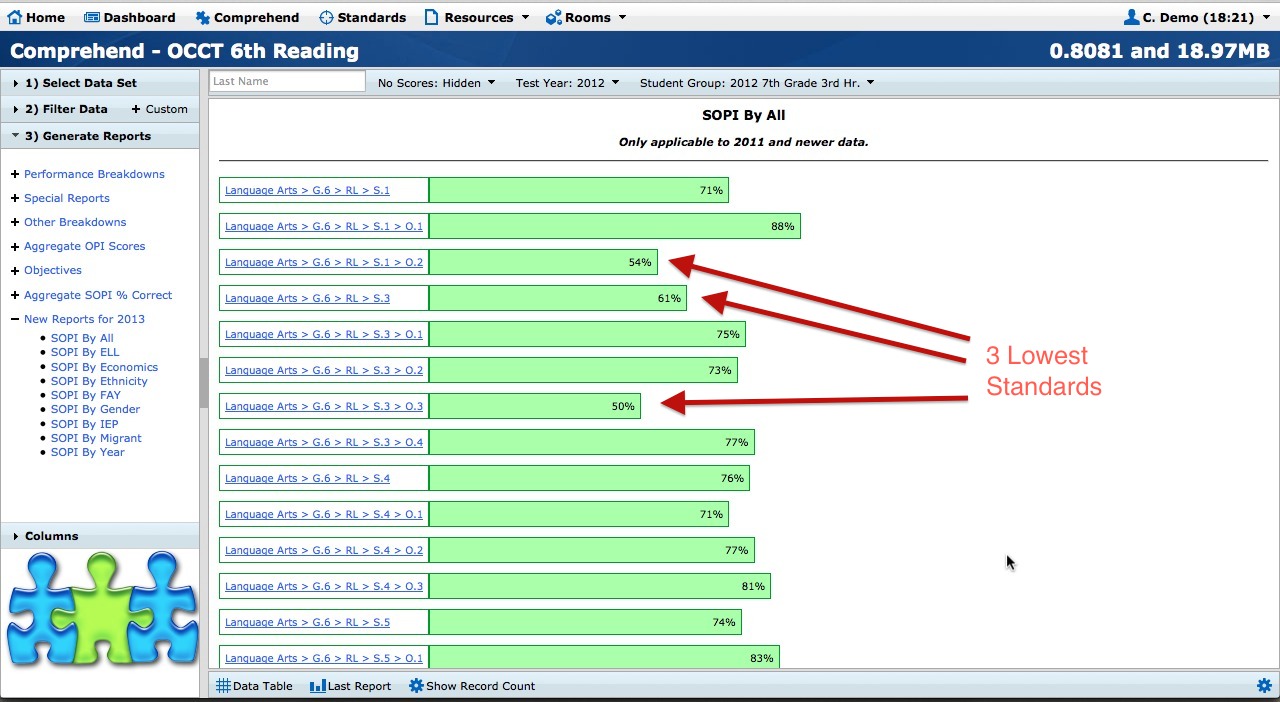
Identify the 3 Highest Standards and 3 Lowest Standards of Performance
Now identify the 3 higest and 3 lowest SOPI Scores by Percentage (Average).
-
Blueprint Standard Dialogue
Identify the Obectives on the Blueprint that were the highest and lowest.
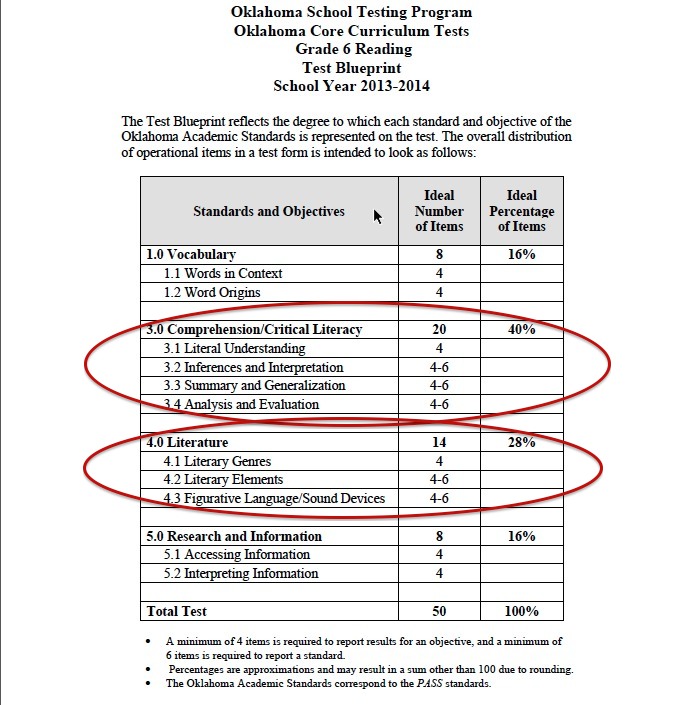
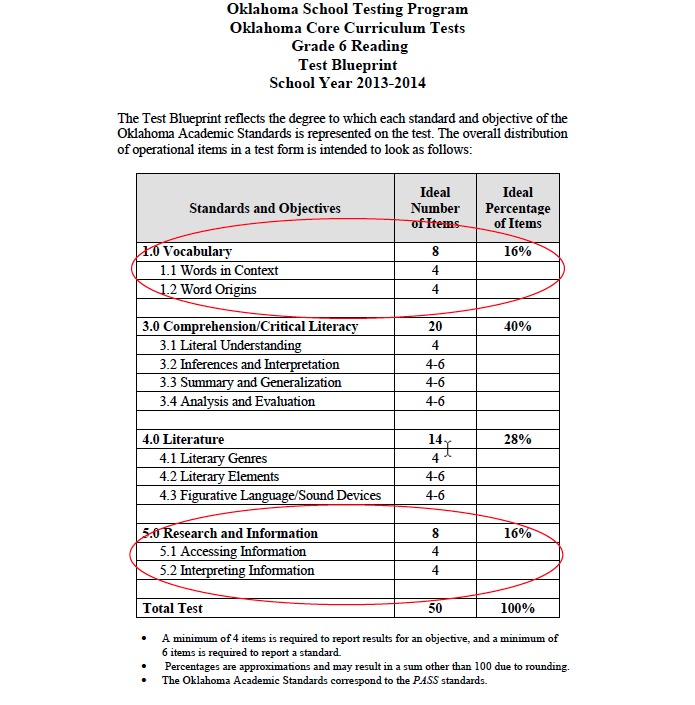
Are your areas of strength and weakness in the Power/Essential Standards? What are the contributing factors for each area? -
Examine Blueprints