T1. Conduct District Trend Analysis
Provides step by step instructions for analyzing OCCT data and generating reports/charts for trends over time for cohort groups, aggregate OPI, objectives and standards, and aggregate SOPI.
Instructional Notes
No Plan Available
Instructions
No Instructions Available
Steps
-
Performance Trend Analysis
- Select Data Set
- Generate Report
- Performance Breakdown
- Test Year
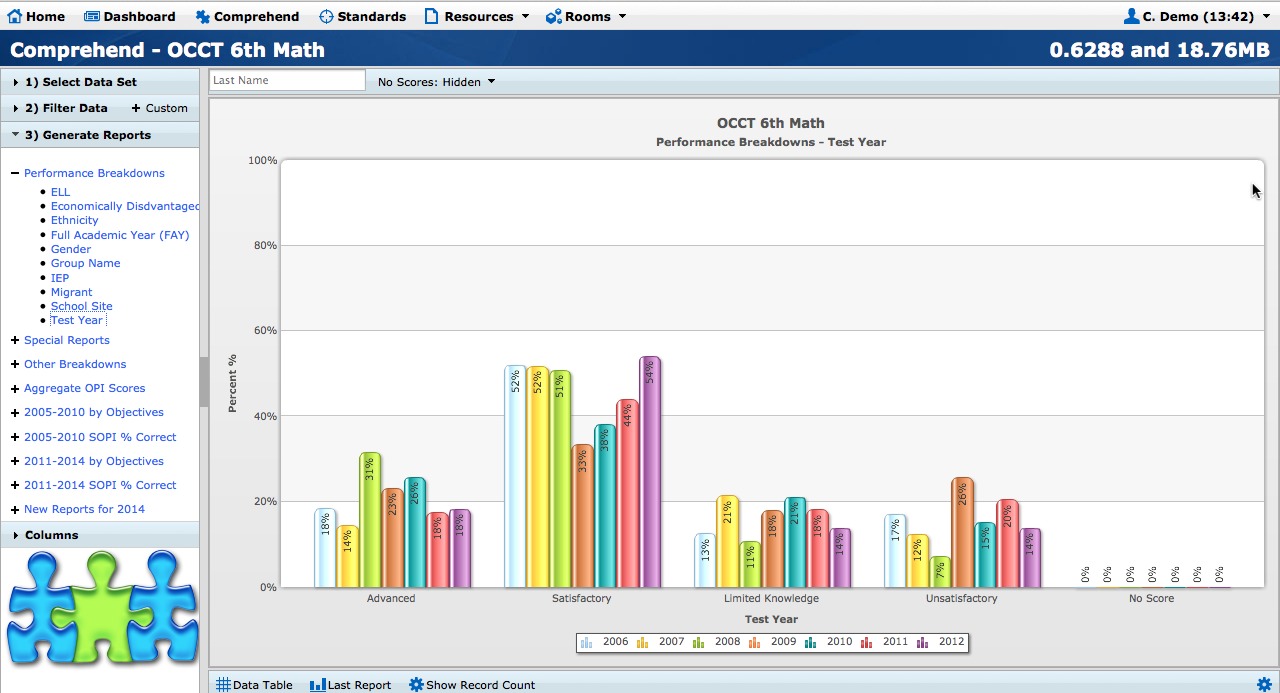
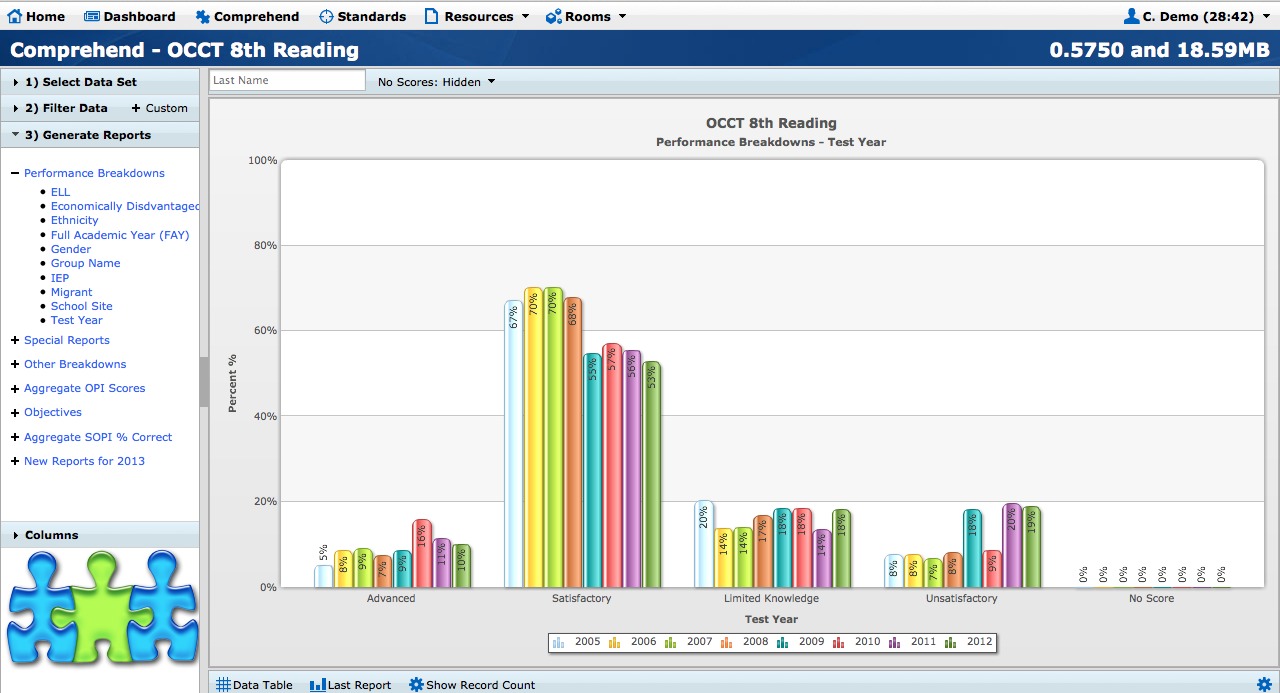
- Performance Breakdown
-
Performance Trend - Questions
- What does the data suggest?
- What are the assumptions we make about students and their learning?
-
Cohort Group Analysis
- Select Data Set
- Generate Report
- Special Reports
- Performance Trend by Grade
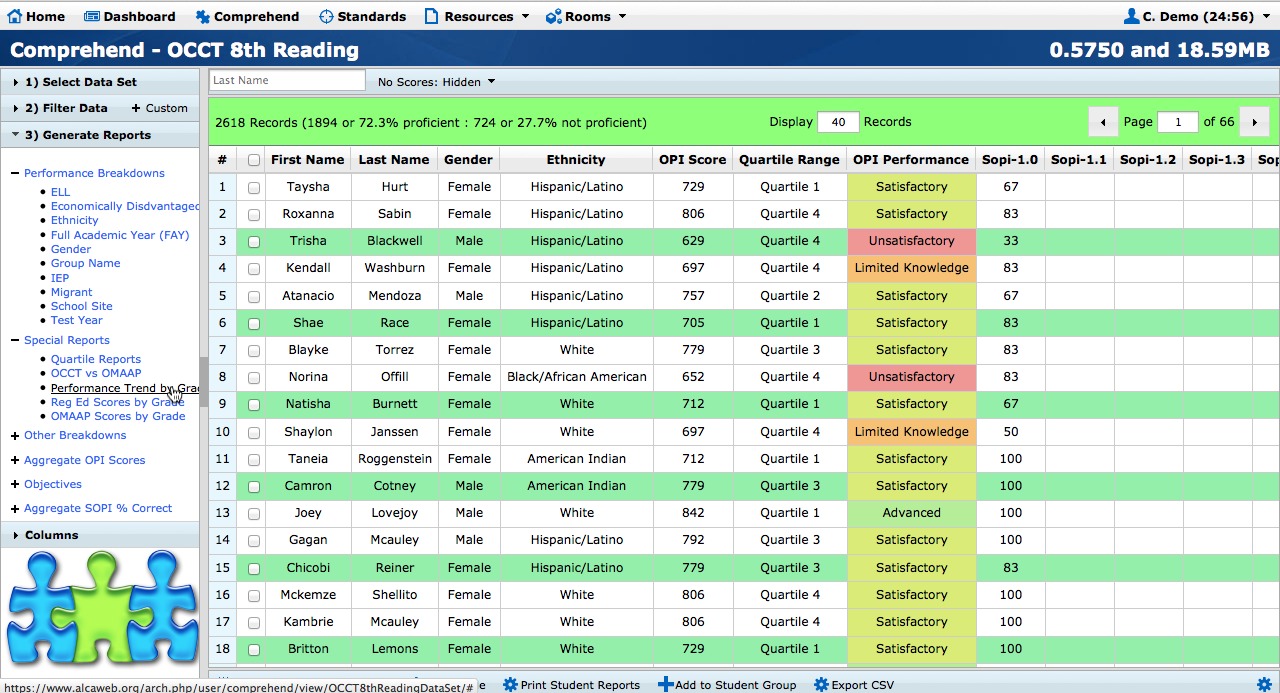
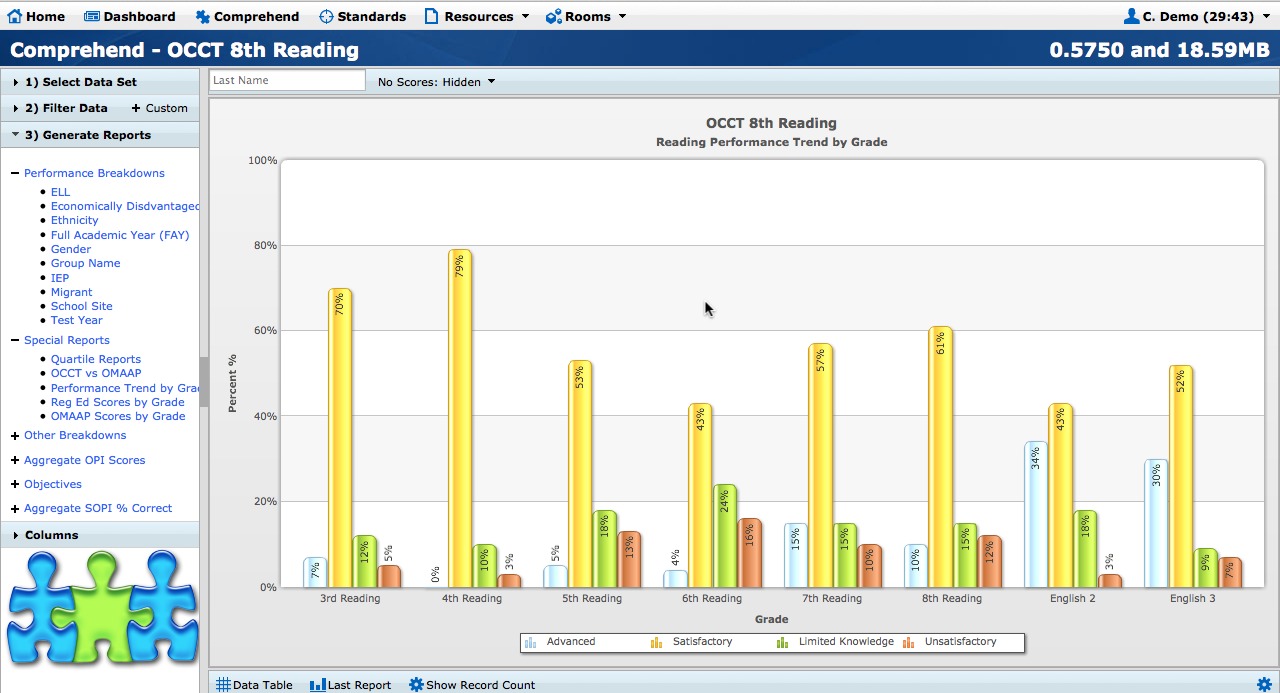
- Special Reports
-
Cohort Group Analysis - Questions
- What does the data suggest?
- What are the assumptions we make about students and their learning?
-
Aggregate OPI
- Select the Data Set
- Generate Reports
- Aggregate OPI
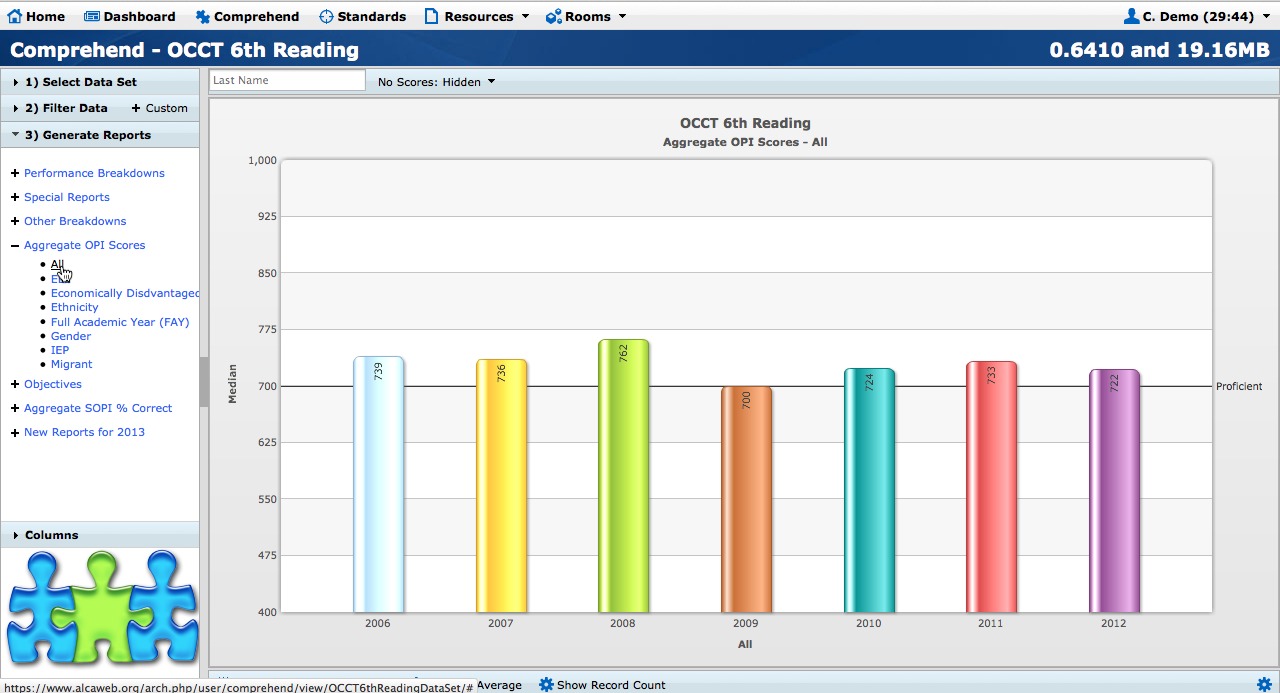
- Aggregate OPI
-
Aggregate OPI - Questions
- What does the data suggest?
- What are the assumptions we make about students and their learning?
-
Objectives/Standards
- Select the Data Set
- Generate Reports
- Objectives (Math 2011-Current)
- Objecitves by Year
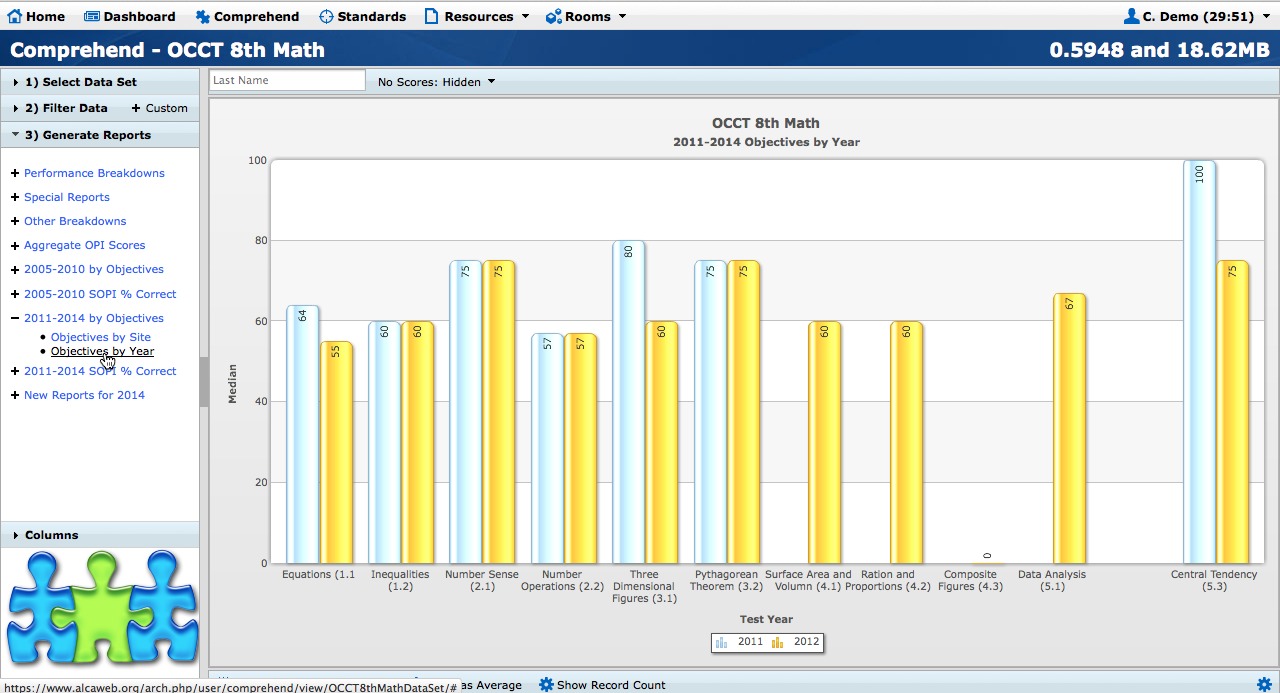
- Objectives (Math 2011-Current)
-
Objectives/Standards - Questions
- What does the data suggest?
- What are the assumptions we make about students and their learning?
-
SOPI Scores by Year
- Select the Data Set
- Generate Reports
- New Reports SOPI % Correct
- By Year
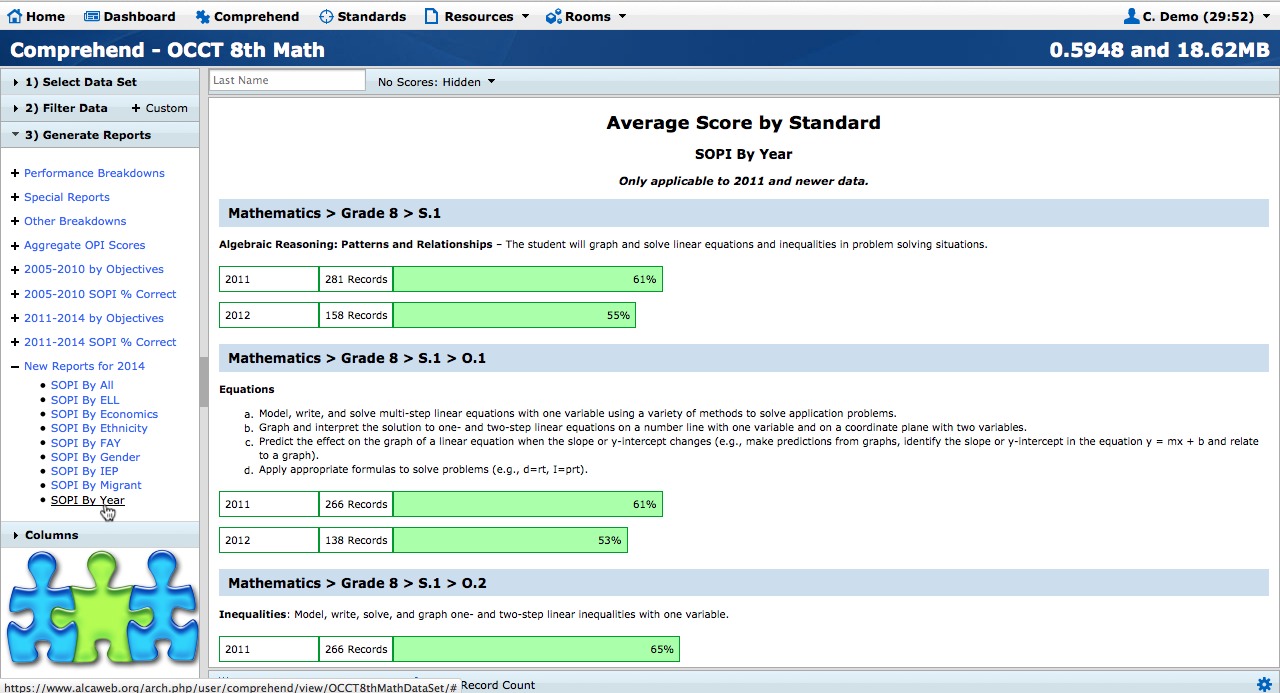
- New Reports SOPI % Correct
-
Aggregate SOPI - Questions
- What does the data suggest?
- What are the assumptions we make about students and their learning?
-
Trend Analysis - Teacher